Did you know that many dams in the US have reached or exceeded their design life? We don't build many new dams because it's difficult to get a dam through the approval process, and partially because this is so, the cost is excessive. We are increasingly dependent on aging dams (like our aging infrastructure as a whole). If a dam is past it's design life it isn't necessarily in danger of failing. In fact in all likelihood most well-designed and built dams will still be sitting there when the lake behind it is filled with silt. But predicting behavior in an earthquake, for example, becomes difficult. We can't say with certainty that a dam 10 years past it's design life of 50 years (60 years old) will behave a certain way in an earthquake - since we don't have similar observation to go by. So we must watch our dams a little more carefully.
How do we watch a dam? In general there are four basic types of measurements one can take to monitor the long term condition of an embankment dam:
- Pore pressure measurements
- Surveying surface points
- Seepage measurements
- Visual observation
Pore Pressure Measurements
The proper design of a dam requires an understanding of how water will ultimately flow through the dam. As the diagram shows below, the idea is to NOT let the phreatic surface, or top of the saturated zone, reach the toe of the dam with enough pressure behind it to flow with destructive force. Many dam designs incorporate clay cores and gravel drains to prevent any seepage to reach the front shell of the dam. Many dam monitoring systems use buried pressure transducers - called "piezometers" - to measure the pore water pressure in the dam and define the phreatic surface. These devices are buried in a dam and can measure water pressure even with very small amounts of water being present.
Figure 1 - Flow net through embankment dams with and without drain blanket
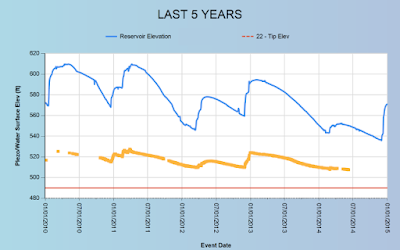
In general, one would like to see measured pressures fall within certain operational limits based on reservoir head and the location of the pressure sensing element. A pressure sensing element placed anywhere within a dam should read close to the design pressure - called the design phreatic surface. In the event of an earthquake (if the dam is located in a seismic zone) then the before and after pressures should be the same. If they are not then one has to quickly determine why. A certain amount of increased pressure might be expected in the less permeable portion of the dam due to pore pressure build up during seismic shaking. But if the dam structure fails in any way that allows a more direct connection to reservoir head, this could cause critical failure. The plot below shows historic pressure readings in a dam in Northern California compared to reservoir elevation data.
Figure 2 - Historic piezometer and reservoir elevation plot
Historical Trends
Having piezometers wired up to a recording system allows pore pressure to be monitored at regular intervals in all conditions. This provides a historical perspective for not only evaluating dam safety, but also understanding the actual conditions within the dam. A piezometer like that shown in Figure 2 shows an attenuated response to reservoir level, but at a lower pressure level than full reservoir head. This is normal response for a piezometer located in the interior of the dam.
Some piezometers located above the phreatic surface will exhibit no response to reservoir head (Figure 3) and some in highly permeable zones (for example in the dam abutment) will mimic reservoir level when water levels are above their tip elevation (Figure 4).
Figure 3 - Historic piezometer plot with no response
Figure 4 - Historic piezometer plot that follows reservoir level
All of these piezometer time series provide a signature - like an electrocardiogram (EKG) does for a heart - of the interior conditions within a dam. From the outside a dam may look static and unchanging, but a electronic monitoring of the dams interior pressure provides a more dynamic picture - one that changes with the seasons and with age. It's an interesting and invaluable perspective for assessing the health of our aging dams.
References:


Dear Jeff Schuyler, please let me add two comments:
ReplyDelete1. On Fig 1 you could have displayed also a Dam Section with not only a Drainage Blanquet but also a Vertical or Chimney Drain (like we have in large Dams.
2. One must remaind the fact that not all Monitoring Instrumengts in the Dam Body mnust have only automated readings. Only those with more importante results. We must have others with manual readings, so that people are forced to came to the Instrument terminal and in doing so, perform also na indirect Visual Inspection. Otherwise it becomes a 'Game' and any problems that may arise between monitored sections of Dam Body may remain undetected, until it may be too late. And also, the electrical or electronic componente to allow for automatic readings slhoud not be a 'Black box' because, whenever doubts arise, you'll need to performe manual readings and also operational testing.
Good comments - I'm glad they are here for other people to see that the issue is not as simple as I have chosen to present it.
Delete